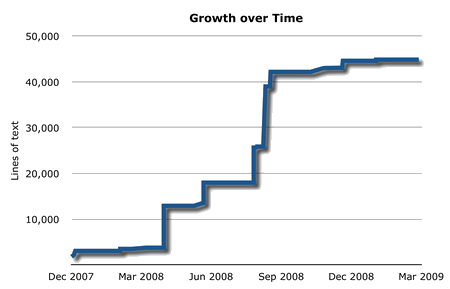
Inspired by Morgan Deters’ Dissertation Countdown, I thought it would be fun to find out how my own dissertation grew over time. Although I never had the foresight to run a nightly script like Morgan’s, I did record all of my changes in a Subversion repository. It’s like having a virtual time machine that can backtrack through the complete history of my work. With a tool such as StatSVN, I can create a nifty graph that shows my research activity over the last couple of years. This one shows the increase in dissertation size over time:

It’s a bit misleading because my dissertation work actually started well before December 2007. I’d been writing code and publishing some initial results in early 2006, but I didn’t start merging it all into a single coherent document until late 2007. Much of the effort from then on was largely a matter of polishing code and evolving the overall narrative, which explains the remarkable growth in the summer of 2008. (It makes me look uncharacteristically productive.) My effort subsided as my defense date drew near, finally ending in March 2009 when I graduated.
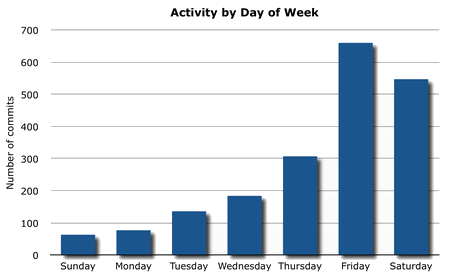
StatSVN can also reveal a finer grain of activity. This one shows the number of commits by day of the week:

There’s a distinct pattern here. My productivity seems to increase closer to the weekend, peaking mysteriously on Friday. One explanation is that I started working full-time before my dissertation was complete. Another explanation is that this is a sad testament to my social life. I prefer to think it’s the former.
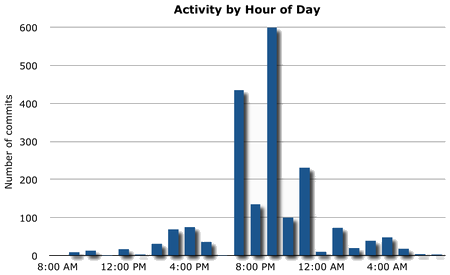
Zooming in even closer on my daily activities, StatSVN can show Subversion commits by hour of day:

I suppose the insight here is that I become super-productive late in the evening, but I’m pretty much dead in the morning hours. If you need me to do something, don’t expect it done before lunchtime.
While these charts show progress over time, I was also curious about what exactly I ended up with. Here are some quick stats I collected about the dissertation itself:
| Pages | 308 |
| Citations | 286 |
| Sentences | 1468 |
| Words | 26757 |
| Average words per sentence | 18.23 |
| Percentage of words with three or more syllables | 23.31% |
| Average syllables per word | 1.79 |
| Gunning fog index | 16.61 |
| Flesch reading ease | 36.76 |
| Flesch-Kincaid grade | 12.00 |
The readability statistics were collected by Juicy Studio’s Readability Test. The fogginess is at 16—pretty high but still in the expected range for an academic paper. The reading ease of 36 (on a 100-point scale) is also depressingly low, considering how much time I spent rewriting my words to make them flow and digest well. The grade level indicates that a person would need at least twelve years of schooling to understand the paper, which sounds about right.
Finally, here’s a tag cloud derived from the text of the dissertation. The bigger the word, the more frequently it occurs in the text.
Nice. I’ll start using statsvn for my dissertation.
I really like this. And (belated) congratulations, Dr. Trevor! 🙂